


Since the moment the decision was reached in 2010, Citizens United v. FEC has been one of the most controversial rulings in recent Supreme Court history. The decision, which found that corporations, including nonprofit corporations, and labor unions cannot be prohibited from spending money on independent political advocacy, is a victory for free political expression. The government cannot and should not be able to ban a political pamphlet, movie, or book, simply “based on the corporate identity of the speaker.”[1]
Nevertheless, the backlash to the decision was, and continues to be, furious. Citizens United, according to some of its detractors, paved the way for political corruption by elevating well-financed interests over regular citizens. Fred Wertheimer, longtime advocate for campaign finance regulation, epitomized the opposition to Citizens United, declaring shortly after the decision that “this opinion will not stand the test of time or history… it is completely inconsistent with the interest of the American people in having a government free from corruption.”[2]
Ten years after the decision, this report asks if such claims about Citizens United were correct. Did the Supreme Court’s ruling that corporations and unions can speak without limit and contribute unlimited amounts to finance independent political expenditures increase the amount of corruption in our democracy?
We find no evidence to support this claim. A comparison of public officials charged with corruption offenses by the U.S. Department of Justice nine years before and nine years after the Court’s decision show a decline rather than an increase in corruption. Further, states that were most affected by Citizens United saw a larger decrease in corruption than states unaffected by the decision.
Citizens United and Corruption: A National Analysis
To measure the effects of Citizens United on public corruption, this report analyzes data on independent expenditures and public officials charged with corruption in the nine years before and after the decision. The corruption data is drawn from the Public Integrity Section of the United States Department of Justice, which has cataloged federal corruption prosecutions for federal, state, and local elected officials and private citizens charged with corrupt acts.[3]
Political corruption is, by its nature, difficult to measure. For example, without acting corruptly, an elected official could push for laws that benefit their constituents, including some donors, believing such measures to be good policy. But an elected official can also, with no corrupt intent, support measures their constituents oppose, believing they are in the best interest of the country.[4] These behaviors are core aspects of our political process.
Since deciphering motives for political action is an impossible and subjective task, this study relies on public corruption prosecutions. If an official is charged criminally with an act of public corruption, then it is highly likely that they acted against both the will and best interest of their constituents.
It is important to emphasize that this data set is limited and thus imperfect. The data do not capture non-criminal “corruption” that is necessarily in the eye of the observer. The data reflect only officials charged with federal corruption and not charges by state or local authorities. Additionally, the data is based on corruption charges and not convictions. Data on corruption charges were used over convictions because the time it takes to bring a case to trial and obtain a conviction can vary considerably and take well over a year from when the actual corrupt act took place, while corruption charges are announced closer to the occurrence of the act. This decision likely overstates the amount of corruption, since individuals could be charged with corruption and later found not to have committed any corrupt act.[5] However, this data set provides a consistent mechanism for evaluating corruption levels. If corruption rises in the United States, one would anticipate a rise in corruption charges in this data set.
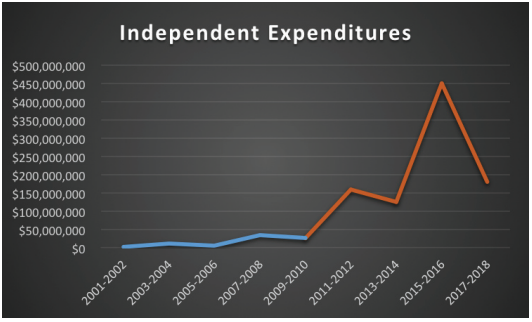
Data on independent expenditures nationally were drawn from the Center for Responsive Politics’ OpenSecrets website.[6] The first graph, titled “Independent Expenditures,” shows federal independent expenditures (excluding party committees) over the 18-year period from 2001-2018 by two-year election cycle. After the Citizens United decision in 2010, which legalized the ability for many speakers to fund independent expenditures, there is a predictable and sharp rise in this type of spending.
If those who argued Citizens United would usher in a new era of corruption were correct, this increase in independent expenditures would correspond with an increase in public corruption. The second graph, titled “Public Corruption Prosecutions,” shows the aggregated total federal corruption prosecutions from 2001-2018, reflecting nine years of data before and after Citizens United. In contrast to what one would expect if Citizens United truly unleashed a tidal wave of political corruption, the data show that, after peaking in 2008, there has been a relatively steady decline in corruption prosecutions over time. Citizens United appeared to have no impact on this trend.
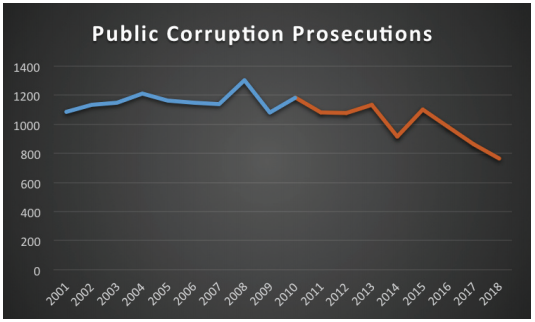
Independent expenditures rapidly rose after Citizens United while corruption prosecutions declined. This method of analysis shows only that there is no association between federal independent expenditures and federal corruption charges. Still, the data strongly suggest there is not a positive relationship between Citizens United and increases in corruption.
Citizens United and Corruption: A Comparative State Analysis
To supplement the federal analysis above, a state by state analysis was conducted. Prior to 2010, the different campaign finance laws in the 50 states resulted in a natural experiment with only roughly half the states being affected by the Court’s decision. According to the National Conference of State Legislatures, 24 states had laws that were affected by the Court’s ruling permitting independent spending by corporations, while 26 states saw relatively little change after the Citizens United decision (usually because these states already allowed corporate and union independent expenditures).[7] This analysis separated the states into two groups: those affected and unaffected. Then, using figures from the Public Integrity Section of the United States Department of Justice, corruption convictions were aggregated across the affected and unaffected states for the nine years before and after the Court’s decision.[8]
To account for differences in population between the two groups, the per capita rate of corruption per million persons was calculated by dividing the corruption figure by the total population in each group. Population statistics were based on 2010 census population data.[9] As the midpoint of the data series and the year of the Citizens United decision, the 2010 census was used in the analysis.[10] If Citizens United contributes to an increase in corruption, then one would expect the per capita corruption rate to increase in states where the decision affected state law. One would also expect states unaffected by Citizens United to show no effect from the decision. Since campaign finance regulations are intended to prevent corruption, nullifying these laws should lead to an increase in public corruption.
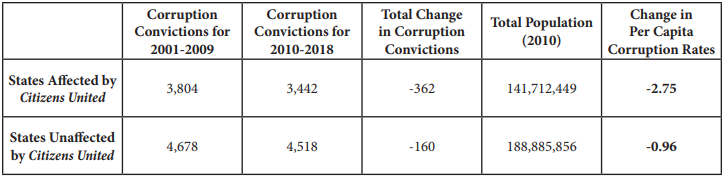
As the data demonstrate, this did not happen. Per capita corruption declined for both affected and unaffected states. More interestingly, states that had banned corporate and/or union speech about candidates – ostensibly to prevent corruption and struck down by Citizens United – experienced a nearly three times larger drop in corruption than states that were not affected by Citizens United.
Conclusion
The Citizens United decision is not correlated to an increase in corruption. As independent expenditures rapidly rose on the national level, public corruption prosecutions declined. A similar trend is observed in the states. If you isolate states that were most affected by Citizens United, the data show that those states experienced a steeper decline in corruption.
These findings are in line with similar academic research. Philip Nichols argues, for example, that lowering campaign contribution limits can actually increase the likelihood of corruption.[11] By increasing transaction costs to raise money, one necessarily increases the benefits of raising money in a corrupt fashion. The legalization of independent political expenditures may have driven down transaction costs for political actors by giving the public more opportunities to legally spread political messages about candidates. It is possible that increased independent expenditures caused a decline in corruption by diminishing the benefits of acting corruptly.
Most importantly, however, there is simply no evidence of a causal relationship between Citizens United and increases in public corruption. Corruption levels are generally unaffected by independent political expenditures. Campaign finance laws, by their very nature, limit the freedom of individuals to engage in political activities. This limitation, otherwise disallowed by the First Amendment, rests on the necessity of preventing corruption. Government officials should be careful to only implement coercive laws when those laws actually target corrupt behavior. The absence of any link between independent expenditures and corruption indicates either no relationship or one where increased speech through independent expenditures actually benefits society. In light of these findings, we should be very cautious before we take any action to overturn or undermine Citizens United. Additionally, critics of Citizens United should re-evaluate their beliefs about the relationship between independent expenditures and corruption until further evidence is found.
[1] Citizens United v. Fed. Election Comm’n, 558 U.S. 310, 364 (2010).
[2] Fred Wertheimer, “Opposing Views Of Campaign Finance Decision,” NPR’s All Things Considered. Retrieved on August 25, 2020. Available at: https://www.npr.org/2010/01/21/122823118/Opposing-Views-Of-Campaign-Finance-Decision (January 21, 2010).
[3] “Report to Congress on the Activities and Operations of the Public Integrity Section for 2018,” United States Department of Justice Public Integrity Section. Retrieved on August 25, 2020. Available at: https://www.justice.gov/criminal/file/1216921/download (2019). This report, published in 2019 and reflecting earlier years, contains the most current available data.
[4] Bradley A. Smith, Unfree Speech. Princeton University Press, 2001, 59.
[5] On the whole, measuring individuals charged with corruption or individuals convicted of corruption makes a negligible difference in the aggregated corruption data.
[6] “Total Outside Spending by Election Cycle, Excluding Party Committees,” Center for Responsive Politics. Retrieved on July 9, 2020. Available at: https://www.opensecrets.org/outsidespending/cycle_tots.php (2020).
[7] Gavin Palmer, “Citizens United and the States,” National Conference of State Legislatures. Retrieved on August 25, 2020. Available at: https://www.ncsl.org/research/elections-and-campaigns/citizens-united-and-the-states.aspx (July 21, 2016).
[8] “Report to Congress on the Activities and Operations of the Public Integrity Section for 2018,” United States Department of Justice Public Integrity Section. Retrieved on August 25, 2020. Available at: https://www.justice.gov/criminal/file/1216921/download (2019). This report did not provide state-based data on individuals charged with corruption, solely data on individuals convicted of corruption-related crimes.
[9] D’Vera Cohn, “State Population Estimates and Census 2010 Counts: Did They Match?” Pew Research Center. Retrieved on August 25, 2020. Available at: https://www.pewsocialtrends.org/2011/01/12/state-population-estimates-and-census-2010-counts-did-they-match/ (January 12, 2011).
[10] Calculations using 2020 population numbers yielded similar results.
[11] Philip M. Nichols, “The Perverse Effect of Campaign Contribution Limits: Reducing the Allowable Amounts Increases the Likelihood of Corruption in the Federal Legislature,” American Business Law Journal Vol. 48(1). Retrieved on August 25, 2020. Available at: https://ssrn.com/abstract=2568220 (October 30, 2011).